How we approached this third national study
The data sources and analytical techniques used for this educational study includes a unique approach to creating a “virtual twin” for each charter school in the dataset, in addition to how we analyze the progress of and outcomes for charter school students and their counterpart in a traditional public school (TPS).
Where does our data come from?
For this educational study, we partnered with education departments in 31 jurisdictions to use their student-level data. We collected student-level demographics, school enrollment and state test scores in reading/English language arts (ELA) and math. We combined this with data from the National Center for Education Statistics (NCES) Common Core of Data (CCD) to construct our national, longitudinal database.
How we calculated student and school growth
This educational study approach mirrors the one used in the 2009 and 2013 studies. The only change to the method was to rematch the charter school students to a new set of TPS students each year. We did this to meet the updated standards of the What Works Clearinghouse at the National Center for Education Evaluation.
With the reauthorization of the Elementary and Secondary Education Act in 2001, commonly known as “No Child Left Behind,” states were required to administer reading and math tests for grades 3–8, as well as test their high school students. High school testing often takes the form of an end-of-course (EOC) exam, which is tied to course enrollment rather than a student’s grade level. EOC tests differ between states in several ways that could impact our growth estimates. These variations included the grade in which the EOC exam was given, the number of times a student is allowed to take the EOC exam, and the time gap between the EOC tested grade and the previously tested grade. All these factors had to be considered when constructing our dataset.
Growth is the change in each student’s score from one school year to the next. For each two-year series of individual student achievement data, we calculated a measure of academic growth. We could compute complete growth data from the 2013–14 school year through the 2017–18 school year. Two states are missing one year of data: Nevada is missing growth data from 2016–17 to 2017–18; Tennessee is missing data from 2015–16. Thus, the first period of growth for Tennessee was measured from 2014–15 to 2016–17.
To assure accurate estimates of charter school impacts, we use statistical methods to control for differences in student demographics and eligibility for categorical program support, such as free or reduced-price lunch eligibility and special education services. In this way, we have created the analysis so that differences in the academic growth between groups of students are a function of which schools they attended.
Additional details about creating the study dataset for the 31 states in this study are available in the Report Downloads section of our website.
Which states participated in the study?
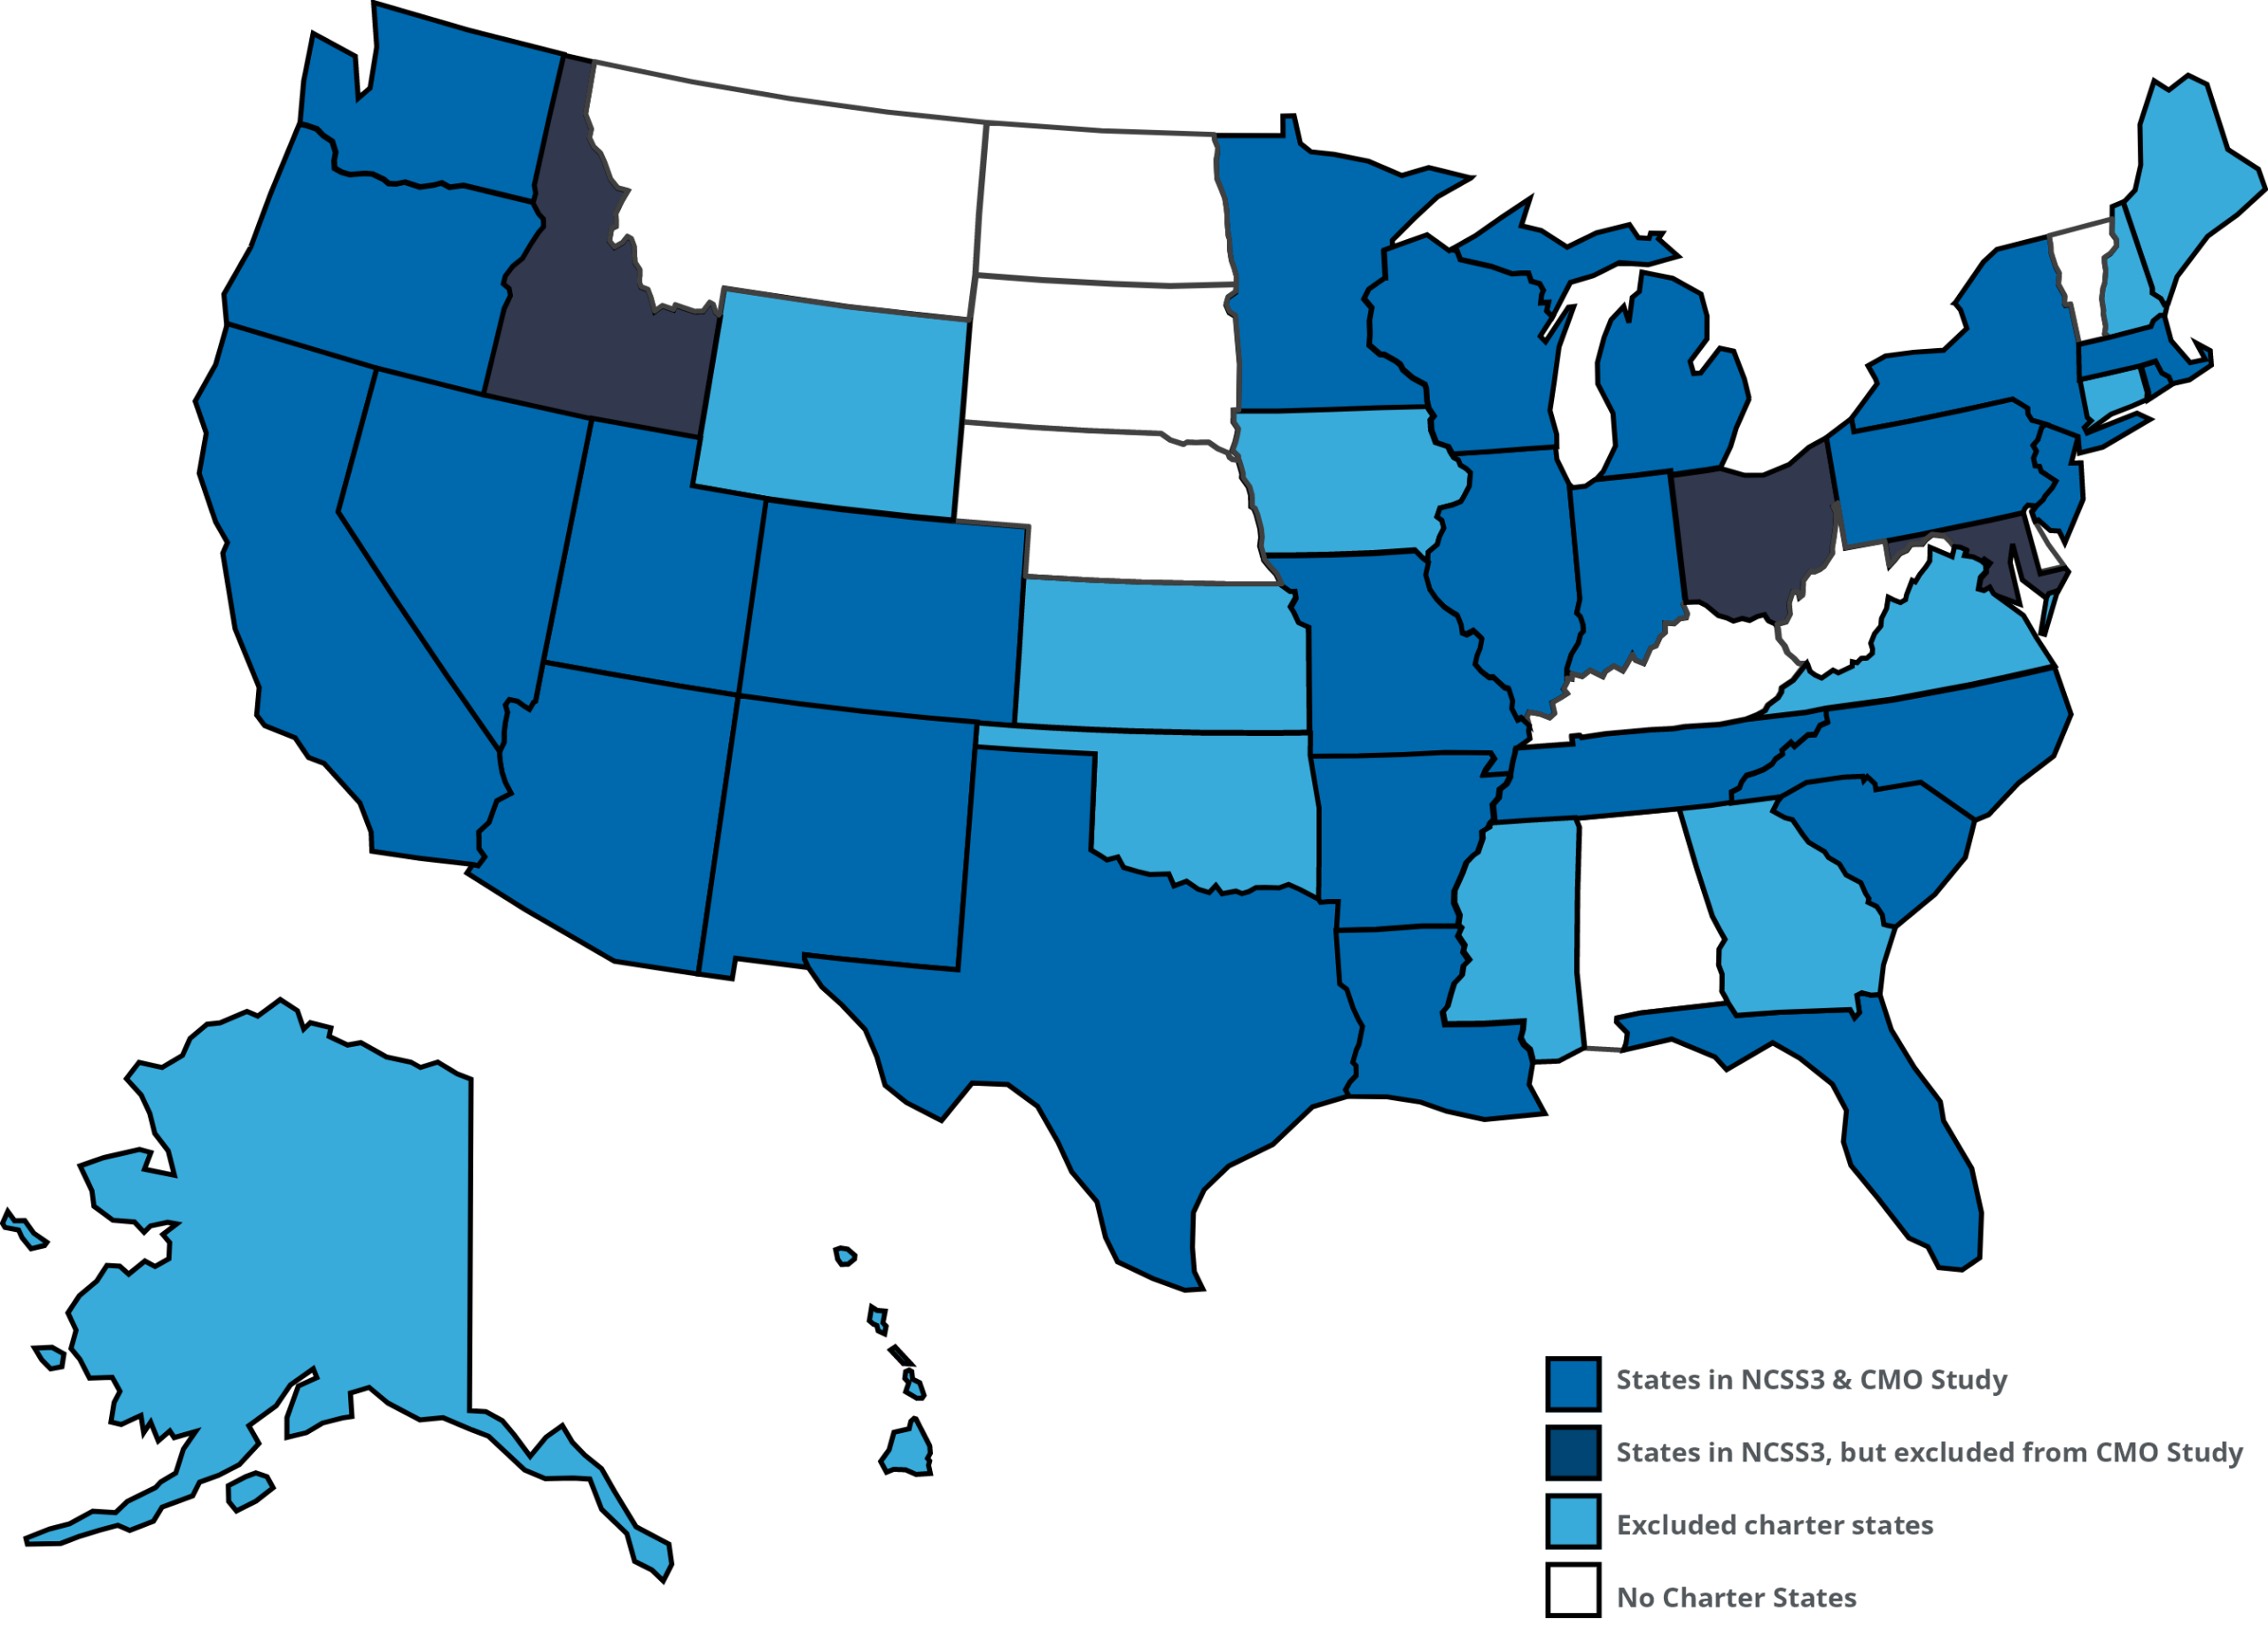
This educational study uses student-level administrative data from 29 states, plus Washington, D.C., and New York City, which, for convenience, we report as 31 states. The data window spans school years from 2014–15 to 2018–19, creating four growth periods. Under FERPA-compliant data-sharing agreements, we use anonymized student-level administrative data. Using test scores from ESSA-mandated achievement tests administered each spring, we calculate the difference in a student’s scores.
Below shows the map of states included in this educational study and charter management organization (CMO) analysis.

