How we approached this third national study
The data sources and analytical techniques used for this educational study includes a unique approach to creating a “virtual twin” for each charter school in the dataset, in addition to how we analyze the progress of and outcomes for charter school students and their counterpart in a traditional public school (TPS).
What’s our process?
Our virtual control record (VCR) method of analysis for this educational study creates a “virtual twin” record for each charter student represented in the data. We then analyze students’ pace of learning by comparing learning gains (or losses) between students enrolled in charter schools and their virtual twins.
Steps in the VCR matching process:
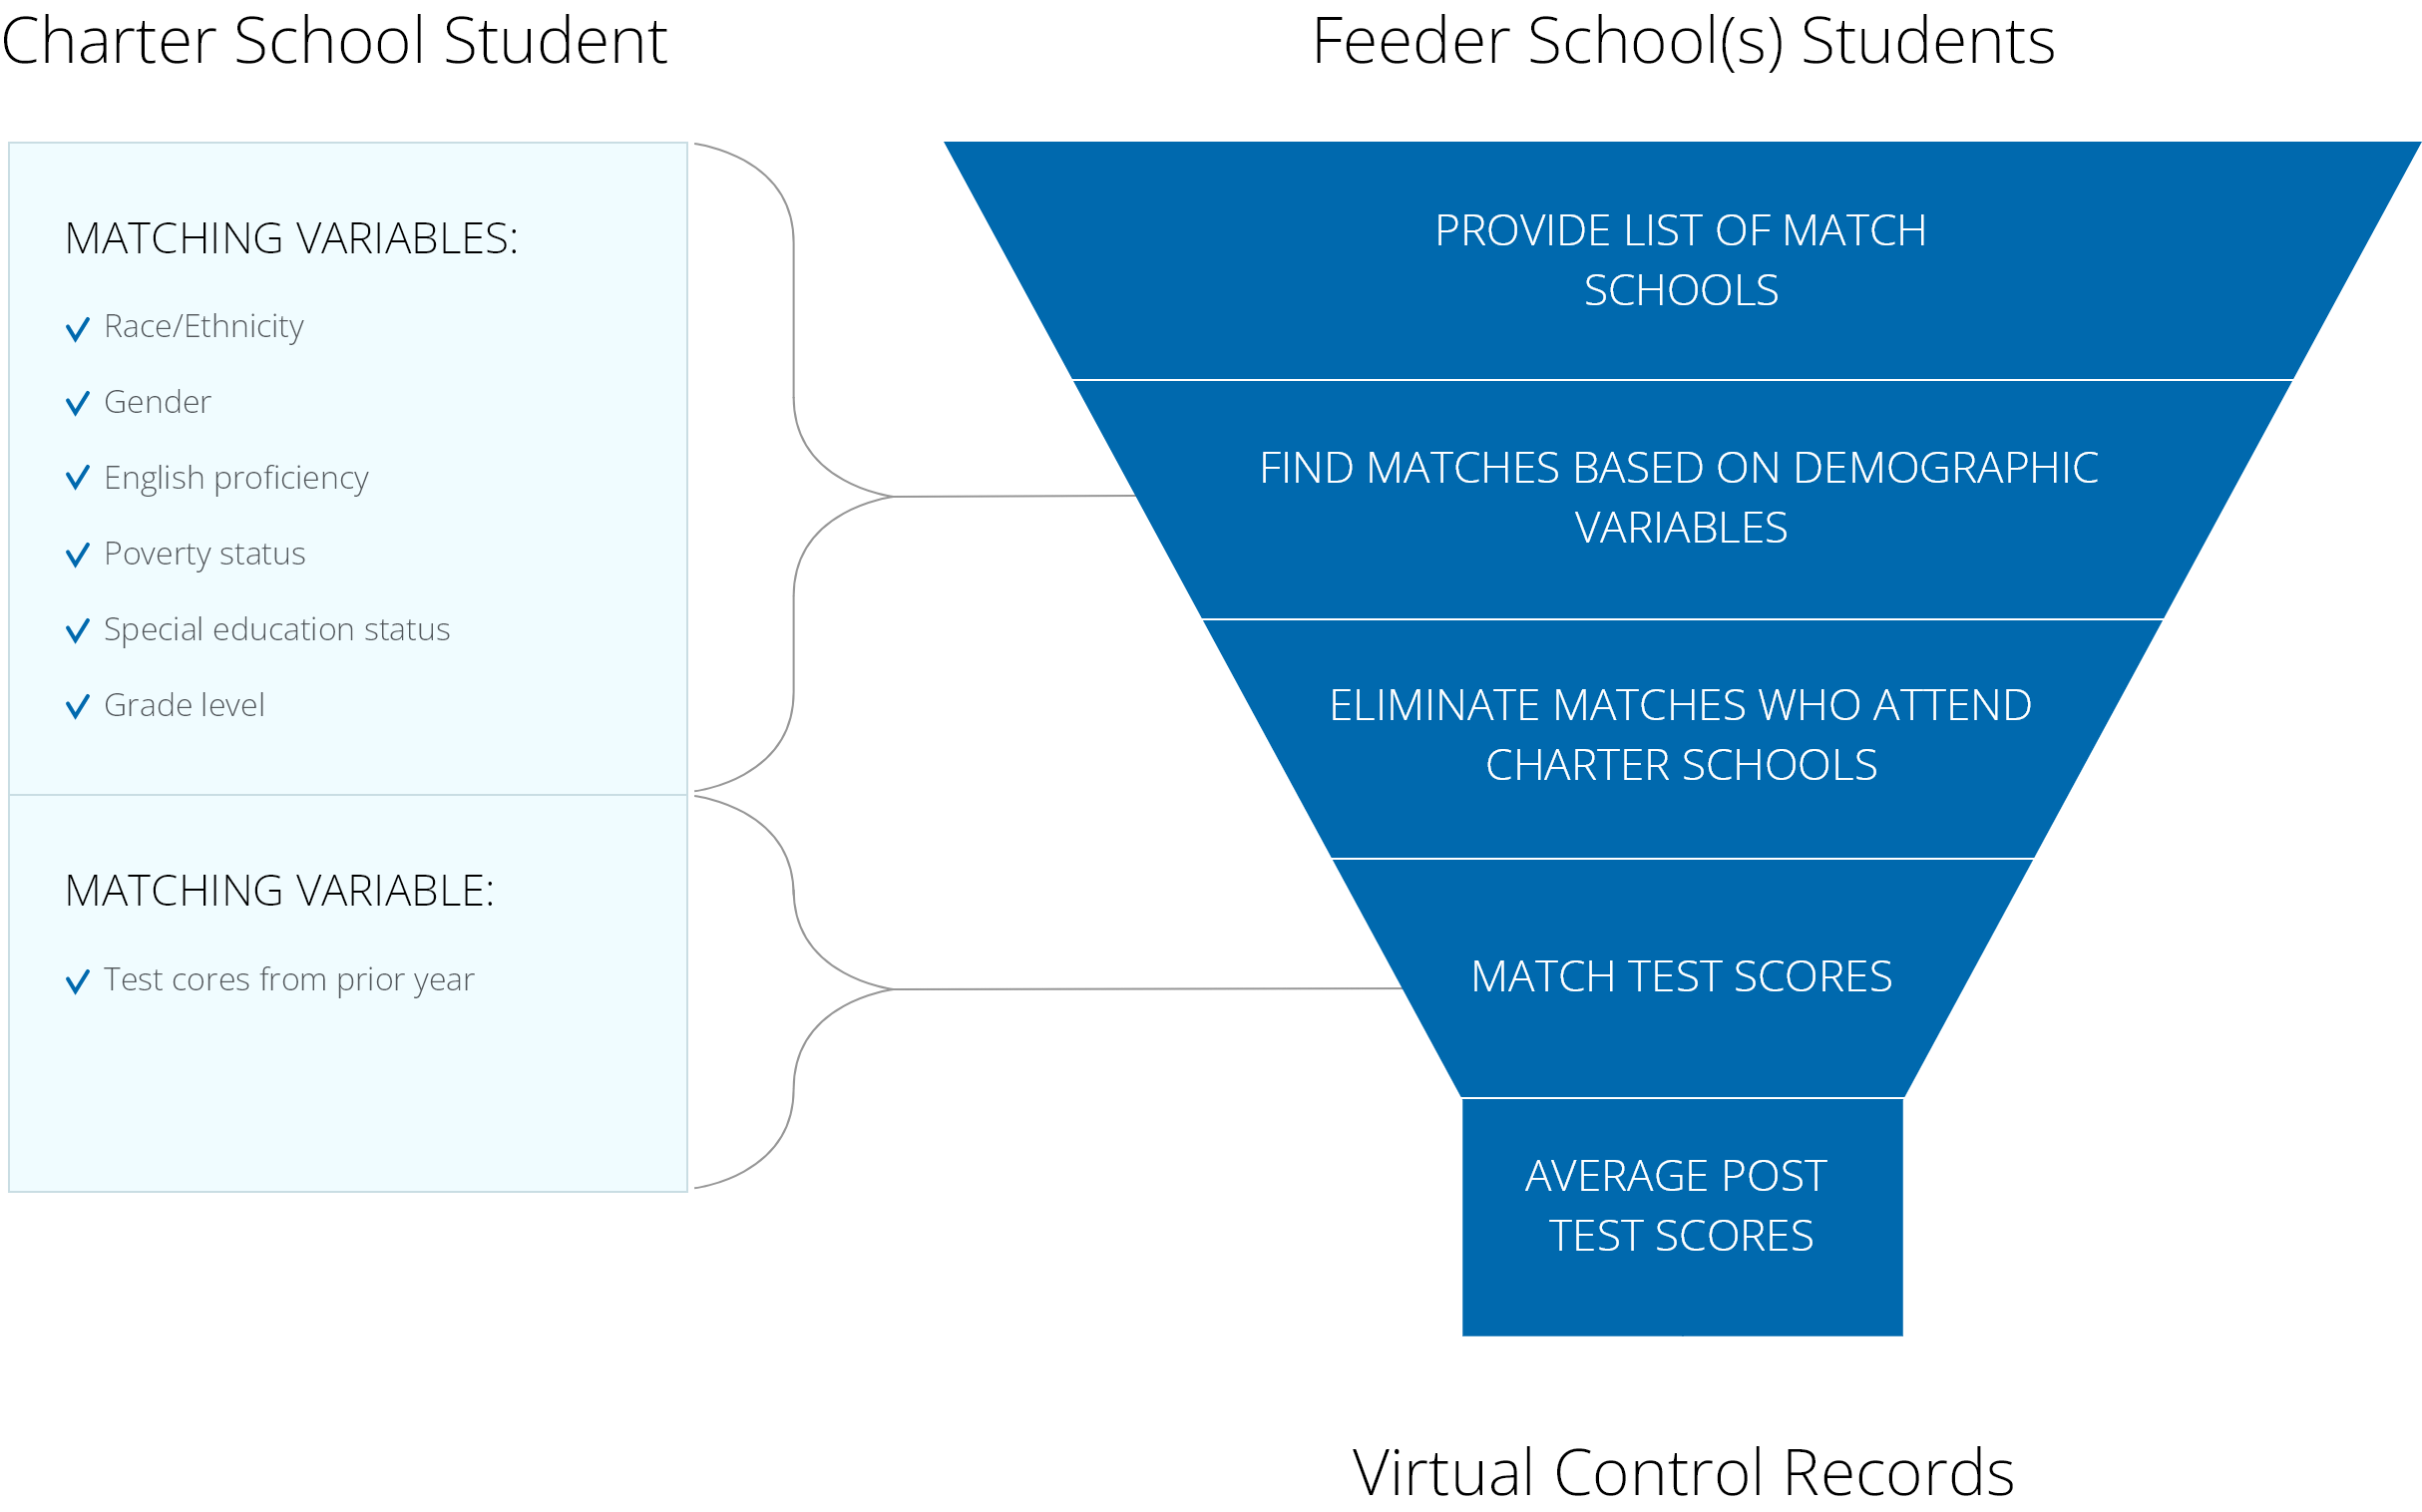
- We identify all students at a given charter school who were enrolled in a TPS during the previous year.
- We identify these TPS as “feeder schools” for each charter school. Each charter school has a unique feeder school list for each year of data.
- All students attending a feeder school are considered potential matches for each charter student.
- We eliminate students attending a charter school from the match pool for each charter student to ensure VCRs consist entirely of TPS students.
- Student records from a feeder school were pooled, which became the source of records for creating the virtual twin match.
- Using the records of TPS students at feeder schools in the year prior to the year of growth, we randomly select up to seven TPS students with identical values on the matching variables in the figure below, including identical or very similar prior test scores.
- The values for the selected TPS students are then averaged to create values for the virtual twin.
- We perform this process separately for reading and math for each student.

