OUR THIRD NATIONAL STUDY
Now in its third version, this study evaluates the academic progress of students enrolled in charter schools in the United States. Using a common methodology across the three studies, results are translated into trends that support insights into the performance of charter school versus public school students over the past 15 years.

Primary research questions
By answering these foundational questions, we aim to extend the pool of research on the effectiveness of charter schools versus public schools and provide insights into how schools, school operators, K–12 academic programs and education policy impact student academic success.
1
Charter vs. TPS
How did the academic growth of charter school students compare to similar students who attended traditional public schools (TPS)?
2
CMO-affiliated impact
How did the academic growth of students attending charter management organizations affiliated with charter schools compare to students attending stand-alone charter schools (SCSes)?
3
Trend over time
What is the trend of charter school effects over time?
Why this point in time is important
A study of the academic impacts of charter school versus public school students is timely. The 2022 results from the National Assessment of Educational Progress removed any ambiguity about student learning after the COVID-19 pandemic. As a country, student academic performance has regressed by two decades in math and fallen steeply in reading, with the most severe performance declines found among minority, poverty and special needs populations that were already struggling before the pandemic. As school and district leaders, policymakers, teachers, families and philanthropists build and implement plans to address pandemic-accelerated declines in student learning, they need an analysis of school and system achievement presented here to guide and support their efforts.
Our work deliberately focuses on a specific outcome: the annual progress that students make over an academic year. In this report, we look at students in charter schools compared to the experience they would have had in the TPS they would have otherwise attended. One notable limitation of this approach is that we have a limited line of sight “under the hood” and into the role that localized environmental, regulatory and organizational factors play on individual school performance. Our contribution to the K–12 education research and practice landscape tests fundamental questions of the effectiveness of charter schools and highlights outcomes and trends rooted in academic progress.
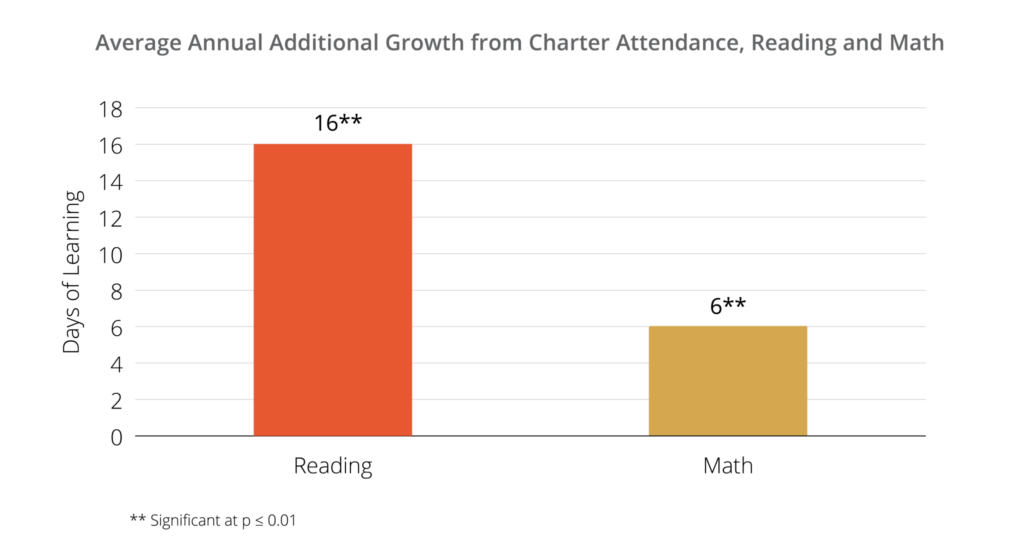
Top-line national results, 2023 study
Looking at year-to-year academic progress from 2015–19, the typical charter school student in our national sample had reading and math gains that outpaced their peers in the TPS they would have otherwise attended. We report these differences as marginal days of additional or fewer days of learning on a learning benchmark of 180 days of learning each school year. In math, charter school students, on average, advanced their learning by an additional six days in a year’s time, and in reading, added 16 days of learning.
These average effects are across all students, all schools, for all time periods. There is considerable variation around these averages, and this variation forms the foundation for the analyses and findings in our two papers.
This growth represents accelerated learning gains for tens of thousands of students across the country. Each student and each school is a proof point that shows it is possible to change the trajectory of learning for students at scale, as well as dramatically accelerate growth for students who have traditionally been underserved by traditional school systems.
What we learned
Do all students benefit?
When we look deeper into these results to determine if all students benefit, we find positive results are not only present in the aggregate, but also across student race/ethnicity groups:
- Black and Hispanic students in charter schools advance more than their TPS peers by large margins in math and reading.
- Multiracial, Native American and White students in charter schools show equivalent progress to their TPS peers in reading but have weaker growth than their TPS peers in math.
- Asian students in charter schools showed similar growth to their TPS peers.
When we examine academic growth for special populations of students, we found that, compared with their TPS peers:
- Charter school students in poverty had stronger growth.
- English-language learner students attending charter schools had stronger growth.
- Students receiving special education services had significantly weaker growth in both math and reading.
Where is positive growth happening?
Deeper into our analysis, we examine where student learning gains occur and find that positive and strong effects exist in charter schools that vary widely by location and configuration.
- States: 18 states in the study produced significantly stronger reading growth for students enrolled in their charter schools when compared with their TPS peers; in 12 states, growth was similar to TPS peers. Students attending charter schools had weaker reading growth than their TPS peers in only one state, Oregon. In 12 states, charter school students had significantly stronger growth in math than their peers in TPS. In 16 states, math growth was similar between charter students and their TPS peers. Only three states showed weaker growth for charter students compared to their peers.
- Locale: Compared to their TPS peers, urban charter school students had 29 additional days of growth per year in reading and 28 additional days of growth in math, both of which were significant. Suburban charter school students also had stronger growth in reading (+14 days) and in math (+3 days). Rural students enrolled in charter schools had the equivalent of 10 days less growth in math than their TPS peers.
- Grade configuration: Charter schools serving elementary, middle and high school students had statistically positive growth in both reading and math. Results for multilevel charter schools were negative in math and similar to the TPS comparison groups in reading. Seeing growth in all grade spans helps us understand that trends in the national aggregate performance are not concentrated in particular grades.
- Continuous enrollment: Charter students overcome the initial dip associated with a school change. By their fourth year in their charter school, they show 45 days of stronger growth in reading than their TPS peers and 39 additional days of learning per year in math. The longer a student stays enrolled in a charter school, the better the student’s academic outcomes are.
- School management: Students who attend a charter school that is part of a CMO experience significantly accelerated growth compared to students enrolled in SCSes. Even so, CMO schools and SCSes provide stronger learning than TPS in reading, and CMOs do so in math. CMO-affiliated students advanced by 27 additional days in reading and 23 more days in math over TPS, which is statistically significant. SCSes still grew significantly more than TPS in reading by 10 additional days of learning but were no different in math. Given that SCSes serve two-thirds of all students enrolled in charter schools, soft math performance in these schools taints the otherwise decisive results in other parts of the study.
What can we learn from CMOs?
Comprising one-quarter of the schools but serving 37% of students in our national dataset, CMOs are producing much of the learning gains we observed for charter school students.
- We find robust results for CMOs not only when we look at top-line results, but also when we grouped their students’ many characteristics. As with all schools, there is a range of performance for CMOs. We share the student impacts of individual CMOs in Appendix A.
Are there variations in charter school performance?
Not every charter school provides a quality academic course of study or an effective learning environment for students. Across all charter schools in our study, 36% has stronger growth, 47% has similar growth and 17% has weaker growth relative to their local TPS. CMO-affiliated charter schools overall display greater performance, with 43% having stronger growth, 42% having similar growth, and 15% having weaker growth than their local TPS. SCSes have slightly more moderate results.
What evidence of improvement exists over time?
Findings from the 2023 report take on even more weight when considered in the historical context of the 15 years we have studied the impact of charter schools. Between the 2009 and 2023 studies, against a backdrop of flat performance for the nation, the trend of learning gains for students enrolled in charter schools is both large and positive. Over the 15 years covered by the studies, the reading growth of students in charter schools rose by 23 days of learning each year. In the same period, student learning in math increased by 37 days of learning each year.